Broad crypto relief rally or structural trend reversal? Analyzing the volatility spike
Technical indicators suggest a countertrend bounce within a primary bearish structure across BTC, SOL, XRP, and SHIB.

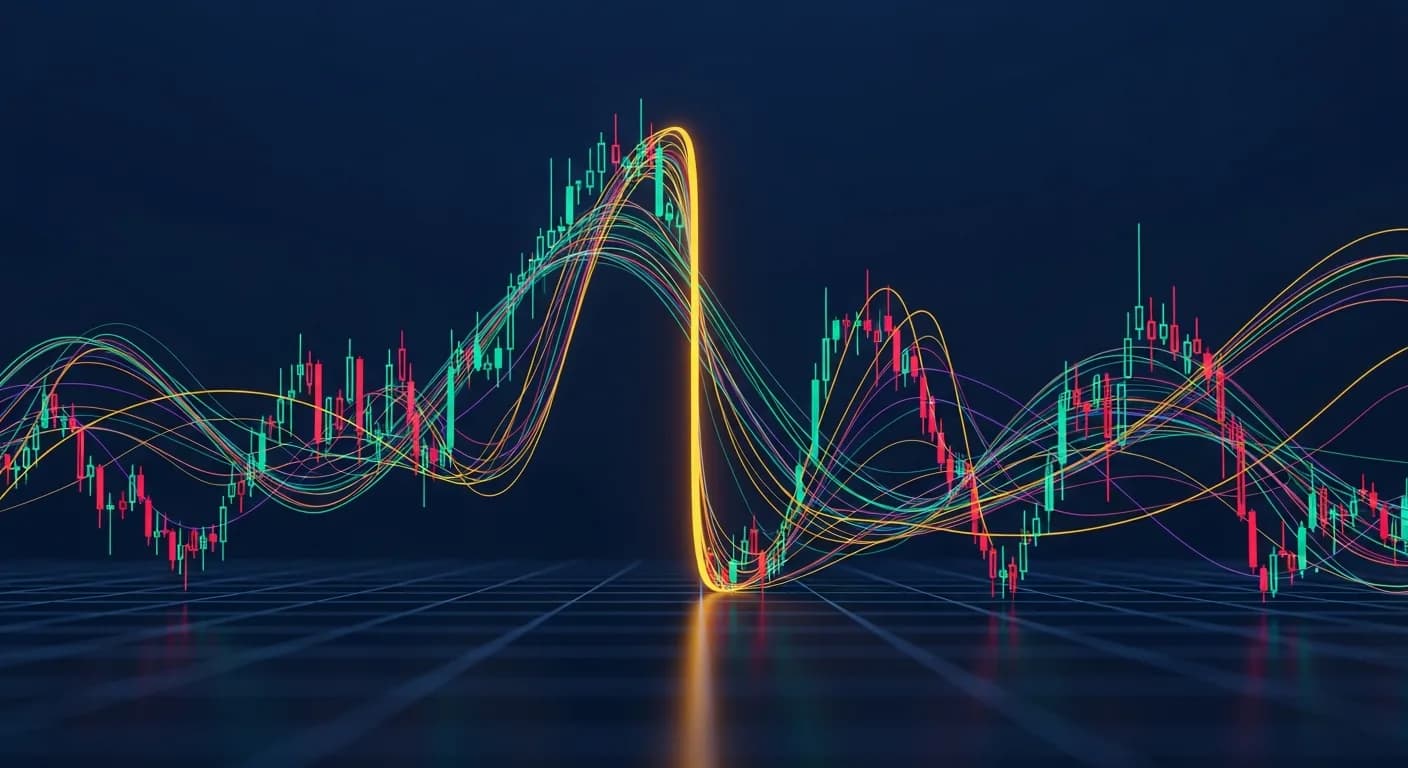
Market Impact Snapshot
Expected 7-day move · by coin
Risk of retesting $60,000 support if the $67,000 resistance level holds on declining trading volume.
Highly correlated to BTC, facing immediate resistance at the $74-$75 zone.
Testing previous support-turned-resistance at $1.22-$1.25 with elevated trading volume.
Weakest structural setup, struggling to reclaim its broken rising wedge support.
Sentiment: Neutral to slightly bearish
Liquidity: medium
AI confidence: 75/100 — an estimate, not a guarantee.
The technical structures across all four analyzed assets are highly aligned, showing classic bearish characteristics. The availability of clear moving average hurdles and volume profiles provides high structural clarity, though short-term volatility can always cause temporary deviations.
Executive summary
According to a technical analysis report by U.Today, the cryptocurrency market has experienced a substantial surge in volatility, sparking a short-term relief rally across major digital assets. This bounce follows a high-volume capitulation move that saw Bitcoin (BTC) break down from its $75,000–$78,000 consolidation range to find support near the $60,000 level. Despite the recent bounce, BTC remains in a medium-term downtrend, trading below its downward-sloping 20-day, 50-day, 100-day, and 200-day moving averages. This alignment indicates that the primary market structure remains heavily bearish, with key resistance situated between the 20-day exponential moving average (EMA) at $67,000 and the 50-day simple moving average (SMA) at $74,000.
Other major assets exhibit highly correlated, structurally weak setups. Solana (SOL) experienced a sharp breakdown from the upper-$80s to the low-$60s, and while it has recovered to approximately $74, it faces immediate resistance at its 20-day EMA ($74–$75) and a dense cluster of moving averages up to $85. XRP is attempting to rebound after breaking below a multi-month declining triangle, returning to test its previous support-turned-resistance zone at $1.22–$1.25 on rising trading volume. Meanwhile, Shiba Inu (SHIB) presents one of the weakest charts, having validated a rising wedge breakdown with a drop to $0.0000045 before staging a tentative bounce to $0.0000051. Across all these assets, the Relative Strength Index (RSI) has recovered from oversold conditions toward the neutral 50 level, indicating a temporary deceleration of downward momentum rather than a structural trend reversal.
Why it matters
From a market-structure perspective, this volatility spike and subsequent relief rally represent a classic mean-reversion move rather than a fundamental shift in capital flows. The high trading volume observed during the initial capitulation suggests significant sell-side participation and liquidations, which cleared out overleveraged long positions. However, the subsequent recovery lacks the sustained, high-volume spot buying necessary to confirm an accumulation phase or a trend reversal. Instead, the current liquidity environment suggests that thin order books are amplifying price swings, allowing minor buying pressure to trigger short-term short squeezes.
In terms of capital flows, there is little evidence of fresh institutional capital entering the market at these levels. Institutional participants typically wait for assets to reclaim key structural levels, such as the 50-day or 200-day moving averages, before committing significant size. Because the entire major asset stack remains below these key indicators, the prevailing order flow is likely dominated by short-term traders and market makers capitalizing on intraday volatility. The fact that high-beta retail assets like SHIB exhibit the weakest market structures further underscores a lack of speculative retail appetite, which is crucial for sustaining broader market expansions.
Consequently, the primary risk for market participants is treating this technical bounce as a confirmed bottom. Historically, when assets rally into a cluster of declining moving averages on declining trading volume, sellers use the liquidity to distribute their positions. This creates heavy overhead resistance, particularly for BTC at $67,000 and SOL at $75. Unless these resistance levels are reclaimed on convincing spot trading volume, the market structure favors a continuation of the primary downtrend, with a high probability of retesting the recent capitulation lows.
Illustrative analogues from history — context, not predictions.
- BTC August 2023 Relief RallyBTC -8% · 14 daysAug 2023Similarity 80%
BTC experienced a sharp capitulation followed by a low-volume relief rally that ultimately rolled over to test deeper support.
- SOL September 2023 Mean ReversionSOL +15% · 10 daysSep 2023Similarity 75%
SOL bounced from oversold conditions but faced heavy overhead resistance at its declining 50-day moving average.
- XRP April 2024 Post-Breakdown BounceXRP flat · 14 daysApr 2024Similarity 70%
XRP broke below a key support level and staged a brief technical retest of the breakdown point before consolidating.
What it means for you
The likely scenarios — and the practical takeaway.
A bullish resolution requires a structural shift in spot market demand to drive prices above immediate overhead resistance. For BTC, this means reclaiming the 20-day EMA at $67,000 and establishing a base to target the 50-day SMA at $74,000 on expanding trading volume. Under this scenario, SOL would need to clear the $75 mark to open up a path toward the $81–$85 resistance cluster. XRP would need to sustain its position above the $1.22 support level and push past the 50-day SMA at $1.32–$1.38. This outcome is highly dependent on a broader macroeconomic risk-on trigger or positive regulatory development that encourages capital inflows rather than short-term speculative trading.
The most likely scenario is a continuation of the primary bearish trend after a brief, low-conviction countertrend bounce. According to the source, BTC and other major assets remain firmly below their 20, 50, 100, and 200-day moving averages, which indicates a strongly bearish market structure. While the RSI has recovered from oversold territory, this momentum shift is characteristic of a relief rally rather than a structural trend reversal. Trading volume, though elevated during the capitulation, must show sustained buying pressure on the way up to confirm a bottom, which is currently lacking. Sellers are highly likely to use these minor rallies to distribute positions, creating heavy overhead resistance. Therefore, we expect assets to consolidate or resume their downward trajectory once the immediate short-term short-covering or mean-reversion momentum fades. This thesis would be invalidated if BTC closes and consolidates above the 50-day SMA at $74,000 on high trading volume, which would signal a shift in market control back to the bulls.
The bearish thesis is supported by the dominant primary downtrend and the fact that all four assets remain below their major moving averages. If the current relief rally stalls on declining trading volume, sellers are highly likely to re-enter the market and drive prices down to test key support levels. BTC failing to break above $67,000 would likely trigger a retest of the critical $60,000 support level, with a breakdown exposing deeper support zones. SOL faces a similar risk of returning to the $63–$65 range if it fails to maintain momentum above $74. XRP and SHIB, which exhibit even weaker technical structures, would likely slide back to their recent lows of $1.05 and $0.0000045, respectively, as technical sellers resume control.
Your takeaway
Traders should treat the current move as a technical relief rally rather than a structural trend reversal. Avoid chasing breakouts until key moving averages (such as BTC's 20-day EMA at $67,000 and SOL's $75 level) are reclaimed on sustained trading volume.
Probabilities are our editorial estimates, not financial advice. How we build these scenarios.
What would change our view?
Real analysis is falsifiable — these are the measurable signals that would move our scenario, in either direction.
Shifts us Bullish
- BTC daily close above $74,000 on above-average trading volume
- SOL daily close above $85, reclaiming its 100-day SMA
Shifts us Bearish
- BTC daily close below $60,000
- XRP daily close below $1.10 on high trading volume
Key insight
The current volatility spike represents a technical countertrend bounce within a primary bearish structure, leaving major assets vulnerable to further downside unless key moving averages are reclaimed on high trading volume.
Tick off what you've already checked — saved on this device.
Key levels to watch
- BTC resistance
- $67,000
- BTC support
- $60,000
- SOL resistance
- $75
- XRP resistance
- $1.22 - $1.25
- SHIB resistance
- $0.0000055
20-day EMA; a break above is required to signal short-term bullish control.
Recent capitulation low and primary psychological support.
20-day EMA and immediate technical hurdle.
Previous triangle support now acting as resistance.
Broken rising wedge support level.
24 hours
neutral
Expect range-bound consolidation as the market digests the initial volatility spike.
7 days
bearish
The relief rally is likely to face exhaustion at key moving average resistances on declining trading volume.
30 days
bearish
Primary bearish market structure remains dominant, pointing to a potential retest of recent capitulation lows.
90 days
neutral
Potential for accumulation and base-building once capitulation selling pressure is fully absorbed.
What could invalidate this read — known unknowns, not predictions.
- A sudden macro liquidity injection or positive regulatory shift could trigger a broad short squeeze.
- Unexpectedly high spot buying volume could invalidate the technical bearish structure.
- Correlations between assets could decouple, leading to idiosyncratic moves (e.g., XRP legal updates).
Bottom line
The most likely outcome over the next 7 to 14 days is a resumption of the primary bearish trend (50% probability) following a brief, low-conviction relief rally. The single biggest risk to this outlook is a sudden short squeeze triggered by a macro liquidity event, which could force a rapid move above key moving averages. Traders should closely monitor BTC's interaction with the 20-day EMA at $67,000 and SOL's immediate resistance at $74–$75 on elevated spot trading volume to confirm if buyers are establishing a genuine floor.
Matched to the highest-ranked CoinGecko listing — always double-check the contract address before trading; impostor tokens reuse real names.
For information and analysis only — not financial advice. Our scenario probabilities are editorial estimates developed through a combination of data analysis, automated research tools, source verification, and human editorial oversight. They may be incorrect and should not be considered investment recommendations. Always conduct your own research before making financial decisions.
More analysis
Related analysis

US-Iran Deal Uncertainty: Will Bitcoin's Recovery Hold or Fade?
Bitcoin's recovery above $67,000 faces headwinds from weak on-chain metrics and declining trading volume, according to LVRG Research and Swissblock. Analysts suggest the price action is heavily dependent on the stability of a recently brokered US-Iran peace deal, with a breakdown potentially triggering volatility.

XRP tests key $1.30 resistance after macro relief — can whale accumulation sustain the breakout?
XRP surged 13% to reclaim $1.28 following reports of easing geopolitical tensions. While on-chain data shows significant whale accumulation, the token faces stiff technical resistance at $1.30 amid broader altcoin recovery.
US Equity Exposure Near Historic Highs — Will a Stock Correction Drag Crypto Down?
US and Canadian investors hold nearly 60% of their financial assets in equities, surpassing levels seen before major historical bear markets. This extreme concentration raises the risk of a sharp traditional market correction, which could trigger systemic deleveraging and liquidity drains across highly correlated risk assets like Bitcoin.